Outcomes-based reimbursement (OBR) whereby payments to manufacturers are made conditional on achieving and/or sustaining a certain patient benefit, can reduce decision uncertainty and facilitate patient access to cell and gene therapies. Such schemes can be particularly useful in situations where a new therapy has a substantial potential long-term health benefit, however, where the available trial data fall short of demonstrating this with the degree of certainty required by key market access stakeholders.
The unmet need
Despite the potential benefits of OBR schemes, the vast majority of innovative therapies launched in England are reimbursed using simple discounts on the list price as a mechanism to address uncertainty around their cost-effectiveness. A commonly cited barrier for the implementation of OBR schemes is the administrative burden of operating them. A key component to operationalising OBR is an appropriate data collection infrastructure (e.g. a database or registry) and practice that provide a framework for recording and managing outcomes data collected in routine clinical practice.
The objective
In previous work, we performed a gap analysis of the SACT dataset and the EBMT registry to identify the key upgrade requirements for enabling OBR in cancer in England, to enable linking reimbursement and payments to clinical outcomes, as well as economic and/or PROMs/PREMs. We showed that both the SACT dataset and the EBMT registry fall short of providing a one-stop data collection infrastructure for enabling OBR in cancer.
The objectives of this exercise include:
- developing a methodological framework for measuring cost of upgrading digital infrastructure for capturing the information needed for OBR through routine clinical practice
- undertaking a top-level estimation of how much it costs to upgrade and integrate the SACT dataset and the EBMT registry with other systems in order to enable OBR more broadly in oncology in England
The deliverable
Methodology
The assumptions and data used to derive the top-level cost estimates were informed by consensus-based primary research discussions with experts in healthcare information technology (IT) systems integration and platform development, as well as experts of the SACT dataset and the EBMT registry. The primary research effort was conducted to explore and validate assumptions around the key activities required to enable the two upgrade scenarios and the associated cost estimates. The focus of the costing exercise is exclusively on costs borne by the NHS, separating between upfront and annual costs for each of the activity requirements.
We explore two different upgrade scenarios to see how different potential approaches to obtaining the necessary data impact the resources required to enable OBR in oncology in England:
- Manual workaround with minimal IT system upgrades:
- Inclusion of additional outcomes data fields to the SACT dataset and the EBMT registry (as necessary)
- Human resources perform all activities where possible, including data collection, outcome performance analysis, assessment of payment and tracking of financial flows
- Existing systems are upgraded and linked through a central platform to enable the most basic form of data integration (via Microsoft Excel modelling) relying heavily on human resources to operationalise
- New system/platform with built-in automation
- Inclusion of additional outcomes data fields to the SACT dataset and the EBMT registry (as necessary)
- Utilises third-party technology and artificial intelligence (AI) to deliver improvements to the SACT dataset and the EBMT registry through capturing of clinical and humanistic outcomes
- Development of a new platform to cross-link data sources and integrate outcomes data collected in routine clinical practice and captured across several systems (e.g. Electronic Health Records (EHR), Secondary Uses Services (SUS), Hospital Episode Statistics and other sources using patients’ NHS ID numbers) with built-in automation of performance analysis and reporting
The key activities within each scenario (i.e. manual workaround/minimal upgrades, and part automation through a new system/platform) are grouped into two main cost categories:
- People
For people-related activities, cost estimates have been derived from assumptions around NHS salaries and fulltime equivalents (FTEs) required to perform activities. Where possible, staff time estimates have been based on similar activities currently being performed by staff, and costed as informed by the bands in the NHS Employers Agenda for Change Pay Scales for 2019-20. The resource categories for people include:
- Training: Ensuring that relevant stakeholders (at local or centralised level) acquire the skills necessary to accurately capture and manage the appropriate data
- Resources: Ensuring that there is sufficient staff resources to perform data collection /management and payment-related activities
- Technology
For technology-related activities, quotes have been retrieved from relevant third-party providers. The resource categories for technology include:
- System upgrade: Upgrading the existing IT systems to provide additional functionality to facilitate the data collection activities required for OBR
- New system: Implementing a new IT system to provide functionality not currently provided by the existing systems
- Software as a Service (SaaS): Licensing of third-party technology provider host applications (e.g. uMotif, Amazon Comprehend) to enable part automation of data capture
Additionally, the costing of the upgrade requirements has been structured according to the executional phase of the upgrade, i.e.: Data input, System integration, Outcomes analysis, Payment assessment, and Payment execution, es exemplified in Figure 1 below.

* The analyses of the resource requirements for Scenario B for SACT and for Scenarios A and B for EBMT were structured similarly
Findings
We present top-level cost estimates for Scenarios A (manual workaround of existing systems) and B (part automation) separately, detailing estimated costs for upgrading the SACT dataset and the EBMT registry. For Scenario A, we present separate analyses for the different types of OBR schemes, i.e. patient-level assessment at national level; patient-level assessment at trust level; cohort-level assessment at national level; and cohort-level assessment at trust level. We present only one result for Scenario B, as the automation means that there is no difference in costs depending on the type of OBR scheme applied. Finally, we separate the results according to:
- Upfront costs: Generally referring to one-off costs such as resource training and implementation of technologies, systems or new practices
- Annual costs: Representing the recurring costs of activities year-on-year e.g. salary costs of resources manually analysing therapy performance, and costs of a managed services team who run and operationalise the technology
Upgrade through manual workaround (Scenario A)
Figure 2 details the estimated cost of upgrading SACT and EBMT using a largely manual workaround to enable the different OBR schemes of interest.
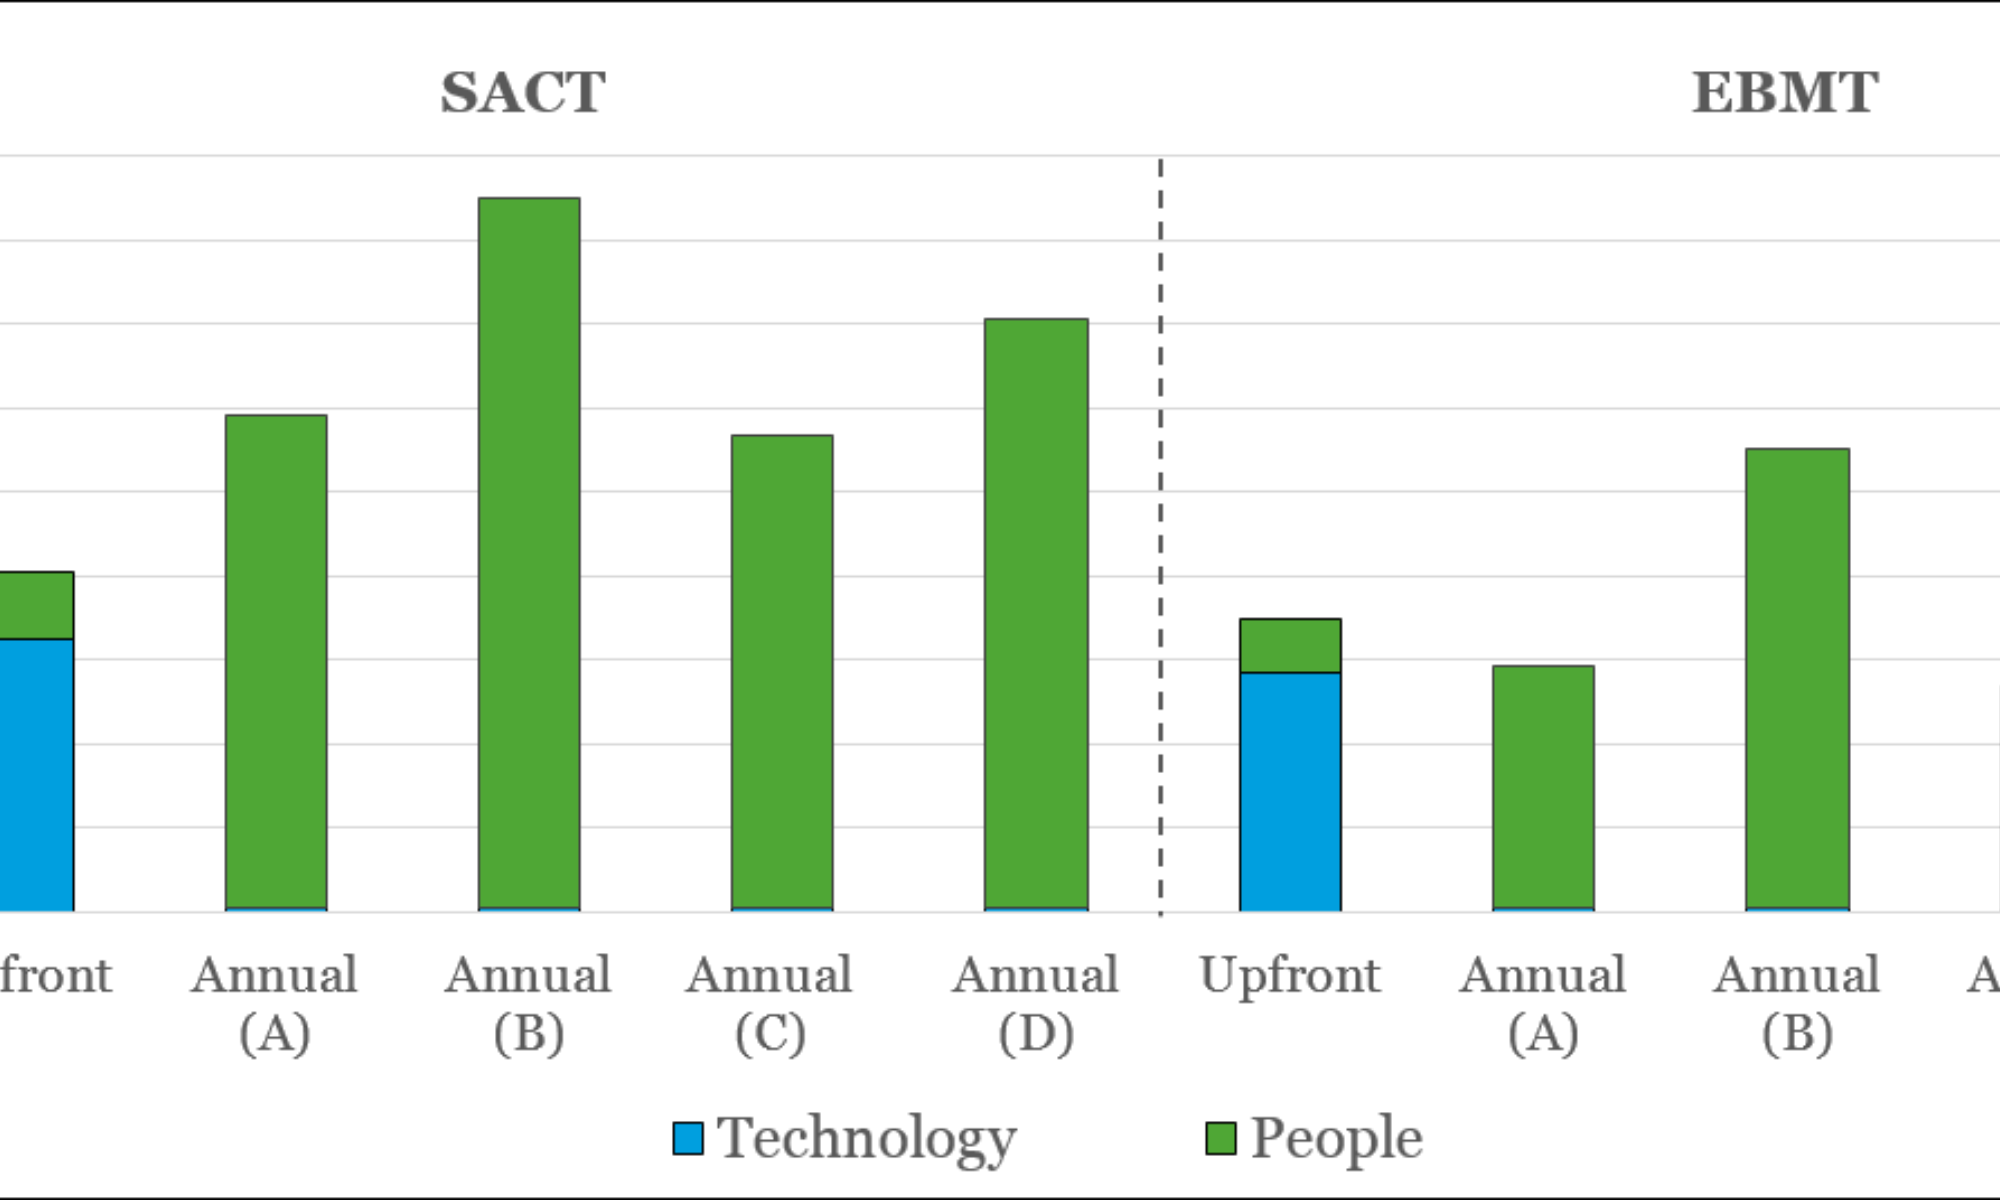
(A) = Patient-level assessment at national level; (B) = Patient-level assessment at trust level; (C) = Cohort-level assessment at national level; (D) = Cohort-level assessment at trust level
The main component of the upfront costs is the costs for the technological upgrade, which is driven by the implementation of a new technology platform to integrate the SACT dataset or the EBMT registry with other data sources, e.g. PROMs/PREMs and SUS. The higher upfront technology costs associated with the SACT upgrade (as compared to EBMT) stems from the need to make more substantial changes to the SACT dataset in order to collect the relevant outcomes, as there are larger gaps in the outcomes collected as compared to the EBMT registry. Around a quarter of the upfront costs pertain to people (staff) resources, and this is driven largely by the provision of training to physicians to increase data completeness. Again, this need is greater in the case of SACT than for EBMT, where data completeness is thought to be better than in SACT (according to expert interviews), resulting in higher upfront people costs for the SACT dataset upgrade as compared to EBMT.
Annual costs are high as compared to upfront costs, especially in the case of SACT. The annual costs of the SACT upgrade are ~£300k higher than for EBMT for each of the analysis scopes (A-D), due to a much greater need for investment in data managers, which are currently not available in all trusts that submit data. The larger number of data managers required for the SACT upgrade (as compared to EBMT) is explained largely by the fact that there are far more trusts submitting data to SACT (141) than to EBMT (53), meaning that there are more centres where this personnel gap needs to be bridged in the case of SACT.
Technology plays a very limited role in terms of annual costs, as the main ongoing technology cost is for the licenses for the third party provider app for capturing PROMs and PREMs. This cost is estimated at £25 per patient per year, which pales in comparison to the additional people (staff) resources needed.
Importantly, in Scenario A (the manual workaround), there is great variation in the estimated annual costs when considering different types of OBR schemes (i.e. national vs. trust-level, and patient vs. cohort-level). Since the assessment of product performance and payment is done manually rather than by technology, it follows that the more patient-centric and/or decentralised analyses are more resource intensive than centralised and/or cohort-level analyses. Importantly, they are also sensitive to the number of products under OBR contracts, as staff costs for e.g. outcomes analysis and payment execution increase proportionally with the number of products under OBR contracts.
The annual costs for a OBR schemes assessed at the individual trust level (B and D in Figure 2) are by far the highest, and intuitively, patient-level assessments are costlier than cohort-level assessments. National-level assessments (A and C) are considerably less costly than trust-level assessments (B and D), as there is less duplication of effort.
Upgrade through part automation (Scenario B)
Figure 3 details the results of the estimated cost of upgrading the SACT dataset and the EBMT registry through part automation.
Our estimated costs of upgrade for the SACT dataset and the EBMT registry under Scenario B are very similar, reflecting a similar need to implement and run a new platform that integrates data from SACT or EBMT, with PROMs/PREMs and other healthcare data sources. The upfront costs in terms of people, e.g. training of physicians to capture the data appropriately, are lower for EBMT than for SACT (assumed to be half) due the lower number of centres reporting to EBMT. The annual costs are the same between the two, and represent the resources needed to run and operationalise the new platform, as well as minor additional staff resources at the Commercial Medicines Unit (CMU) at NHS England to track payments and rebates.
Our estimates show that the upfront investment needed to enable OBR through part automation is around five times higher than the upfront investment needed for the manual workaround (Scenario A). While the upfront investment is considerably higher, the subsequent annual costs associated with part automation are considerably lower. Importantly, the annual costs are not sensitive to the number of products, as the system is largely automated, and does not require substantial additional staff resources as the number of products increases.
Cumulative costs over time
The substantial difference in annual costs between Scenarios A and B mean that the cumulative costs also differ greatly over time, as illustrated in Figure 4. We present the cumulative costs for the most and least costly approaches for Scenario A (where ‘high’ corresponds to patient-level schemes at individual trusts, and ‘low’ corresponds to cohort schemes at national level) in the green and blue bars, and the cumulative costs for Scenario B by the grey line, showing an average of the EBMT and SACT results, as the respective costs are quite similar for Scenario B.
* Future costs discounted at an annual rate of 3.5%
Low = Outcomes assessed at the cohort/national level; High = Outcomes assessed at the patient/trust level
Our top-level estimates of cumulative costs show that although part automation is more costly than the manual workaround initially, this dynamic changes over time. After five years, the part automation solution (Scenario B) becomes less costly than the manual upgrade (Scenario A, for both ‘high’ and ‘low’ estimates) for SACT. The situation is more nuanced in the case of longer-term cumulative costs for upgrading EBMT. After five years, Scenario B (part automation) becomes less expensive than the manual workaround if we consider the more resource-intensive and costly schemes like assessing patient-specific outcomes at trust level (‘high’). However, if we consider national-level cohort schemes using a manual workaround for EBMT (Scenario A, ‘low’ in Figure 4), this remains a less costly option than part automation (Scenario B) well beyond the 10 years shown in the graph (and up to 47 years). It should be noted that this assumes that neither the number of centres reporting into EBMT, nor the number of contracts/products under OBR schemes would increase, which may not be a realistic expectation; if either of these increase, the part automation (Scenario B) would become less expensive than Scenario A (‘low) sooner for EBMT .
Learnings
In terms of the costs required to upgrade the SACT dataset and the EBMT registry to enable OBR, the SACT dataset is more costly to upgrade than the EBMT registry. This is partly due to the greater shortcomings associated with SACT, but also due to the fact that there are more trusts reporting into it than EBMT.
We have shown that part automation is a far more scalable option than the manual workaround (which is sensitive to the number of trusts and products under OBR), and less reliant on staff resources (which are very scarce in the NHS), meaning it has a better chance of being fit for purpose also with any changing requirements in the future. Taking the longer view on costs pays dividends in terms of flexibility, which will be key to future-proofing the system.
We believe that an appropriately automated and scalable data collection infrastructure should be implemented, with the ability to integrate clinical, economic and patient-reported outcomes with healthcare cost data and payment systems, to enable OBR not only in cancer, but also in other therapy areas (as operated in Italy and Spain). Such a system should ideally also provide transparency to both manufacturers and NHS stakeholders so that all parties can learn from the outcomes collected in the real world, and maintain confidence in that the financial implications represent the terms that are pre-agreed.
It is particularly important to ensure that this data is a resource that clinical staff can benefit from, as such learnings encourage further improvements in patient care, as well as keeping data quality and completeness high. All stakeholders in the healthcare ecosystem win if patient outcomes are improved, and this requires a concerted effort by all involved to become a reality.